Tables
New in 2.7.0
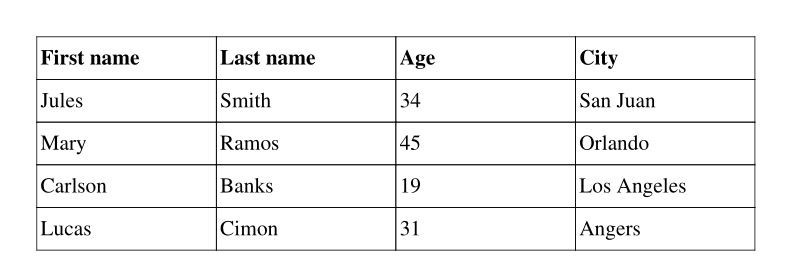
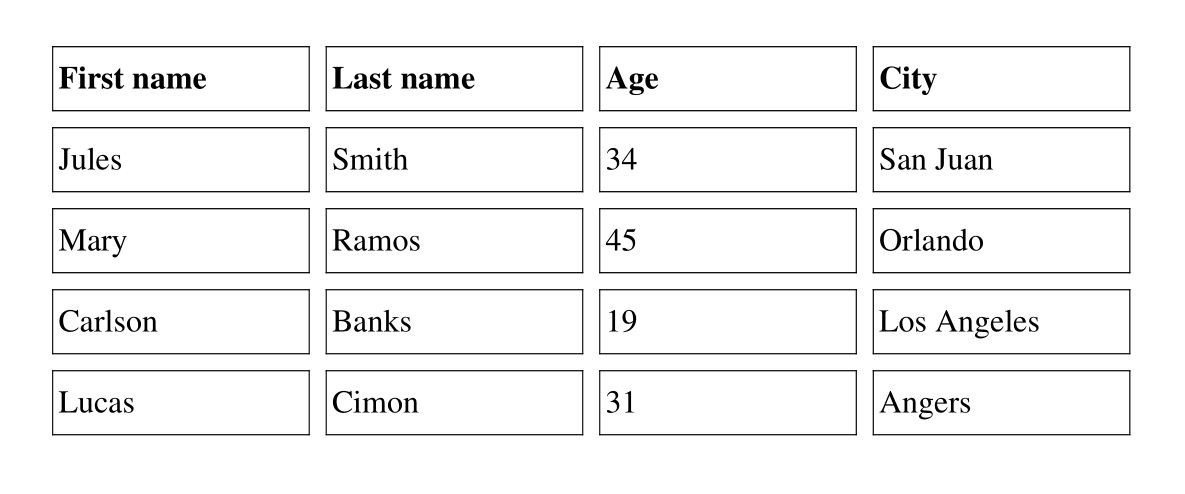
Tables can be built using the table() method. Here is a simple example:
from fpdf import FPDF

TABLE_DATA = (
    ("First name", "Last name", "Age", "City"),
    ("Jules", "Smith", "34", "San Juan"),
    ("Mary", "Ramos", "45", "Orlando"),
    ("Carlson", "Banks", "19", "Los Angeles"),
    ("Lucas", "Cimon", "31", "Angers"),
)
pdf = FPDF()
pdf.add_page()
pdf.set_font("Times", size=16)
with pdf.table() as table:
    for data_row in TABLE_DATA:
        row = table.row()
        for datum in data_row:
            row.cell(datum)
pdf.output('table.pdf')
Result:
Features
- support cells with content wrapping over several lines
- control over column & row sizes (automatically computed by default)
- allow to style table headings (top row), or disable them
- control over borders: color, width & where they are drawn
- handle splitting a table over page breaks, with headings repeated
- control over cell background color
- control over cell borders
- control table width & position
- control over text alignment in cells, globally or per row
- allow to embed images in cells
- merge cells across columns and rows
Setting table & column widths
The col_widths optional parameter can be provided to configure this.
If a single number is provided as col_widths, it is interpreted as a fixed column width in document units.
If an array of numbers is provided as col_widths, the values are considered to be fractions of the full effective page width, meaning that col_widths=(1, 1, 2) is strictly equivalent to col_widths=(25, 25, 50).
...
with pdf.table(width=150, col_widths=(30, 30, 10, 30)) as table:
    ...
Result:
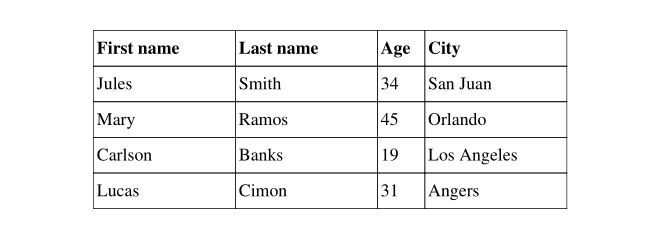
align can be passed to table() to set the table horizontal position relative to the page, when it's not using the full page width. It's centered by default.
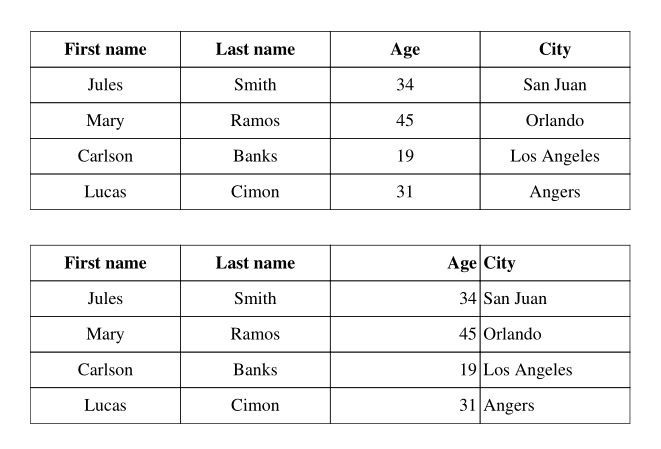
Setting text alignment
This can be set globally, or on a per-column basis:
...
with pdf.table(text_align="CENTER") as table:
    ...
pdf.ln()
with pdf.table(text_align=("CENTER", "CENTER", "RIGHT", "LEFT")) as table:
    ...
Result:
Setting cell padding
New in 2.7.6
Cell padding (the space between the cells content and the edge of the cell) can be set globally or on a per-cell basis.
Following the CCS standard the padding can be specified using 1,2 3 or 4 values.
- When one value is specified, it applies the same padding to all four sides.
- When two values are specified, the first padding applies to the top and bottom, the second to the left and right.
- When three values are specified, the first padding applies to the top, the second to the right and left, the third to the bottom.
- When four values are specified, the paddings apply to the top, right, bottom, and left in that order (clockwise)
    ...
red = (255, 0, 0)
style = FontFace(color=black, fill_color=red)
with pdf.table(line_height=pdf.font_size, padding=2) as table:
    for irow in range(5):
        row = table.row()
        for icol in range(5):
            datum = "Circus"
            if irow == 3 and icol % 2 == 0:
                row.cell("custom padding", style=style, padding=(2 * icol, 8, 8, 8))
            else:
                row.cell(datum)
(also an example of coloring individual cells)
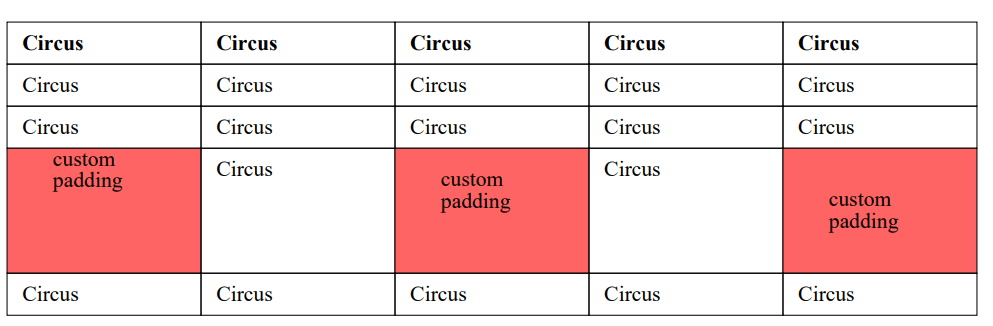
Note: the c_margin parameter (default 1.0) also controls the horizontal margins in a cell. If a non-zero padding for left and right is supplied then c_margin is ignored.
Setting vertical alignment of text in cells
New in 2.7.6
Can be set globally, per row or per cell, by passing a string or a VAlign enum value as v_align:
...
with pdf.table(v_align=VAlign.M) as table:
    ...
    row.cell(f"custom v-align", v_align="TOP")
Setting row height
First, line_height can be provided to set the height of every individual line of text:
...
with pdf.table(line_height=2.5 * pdf.font_size) as table:
    ...
New in 2.8.3
Second, a global min_row_height can be set, or configured per row as min_height:
...
with pdf.table(min_row_height=30) as table:
    row = table.row()
    row.cell("A")
    row.cell("B")
    row = table.row(min_height=50)
    row.cell("C")
    row.cell("D")
Disable table headings
By default, fpdf2 considers that the first row of tables contains its headings. This can however be disabled:
...
with pdf.table(first_row_as_headings=False) as table:
    ...
New in 2.7.9
The repetition of table headings on every page can also be disabled:
...
with pdf.table(repeat_headings=0) as table:
    ...
"ON_TOP_OF_EVERY_PAGE" is an equivalent valid value for repeat_headings , cf. documentation on TableHeadingsDisplay.
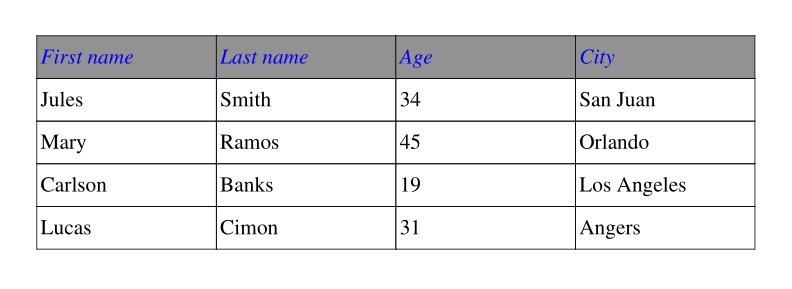
Style table headings
from fpdf.fonts import FontFace

...
blue = (0, 0, 255)
grey = (128, 128, 128)
headings_style = FontFace(emphasis="ITALICS", color=blue, fill_color=grey)
with pdf.table(headings_style=headings_style) as table:
    ...
Result:
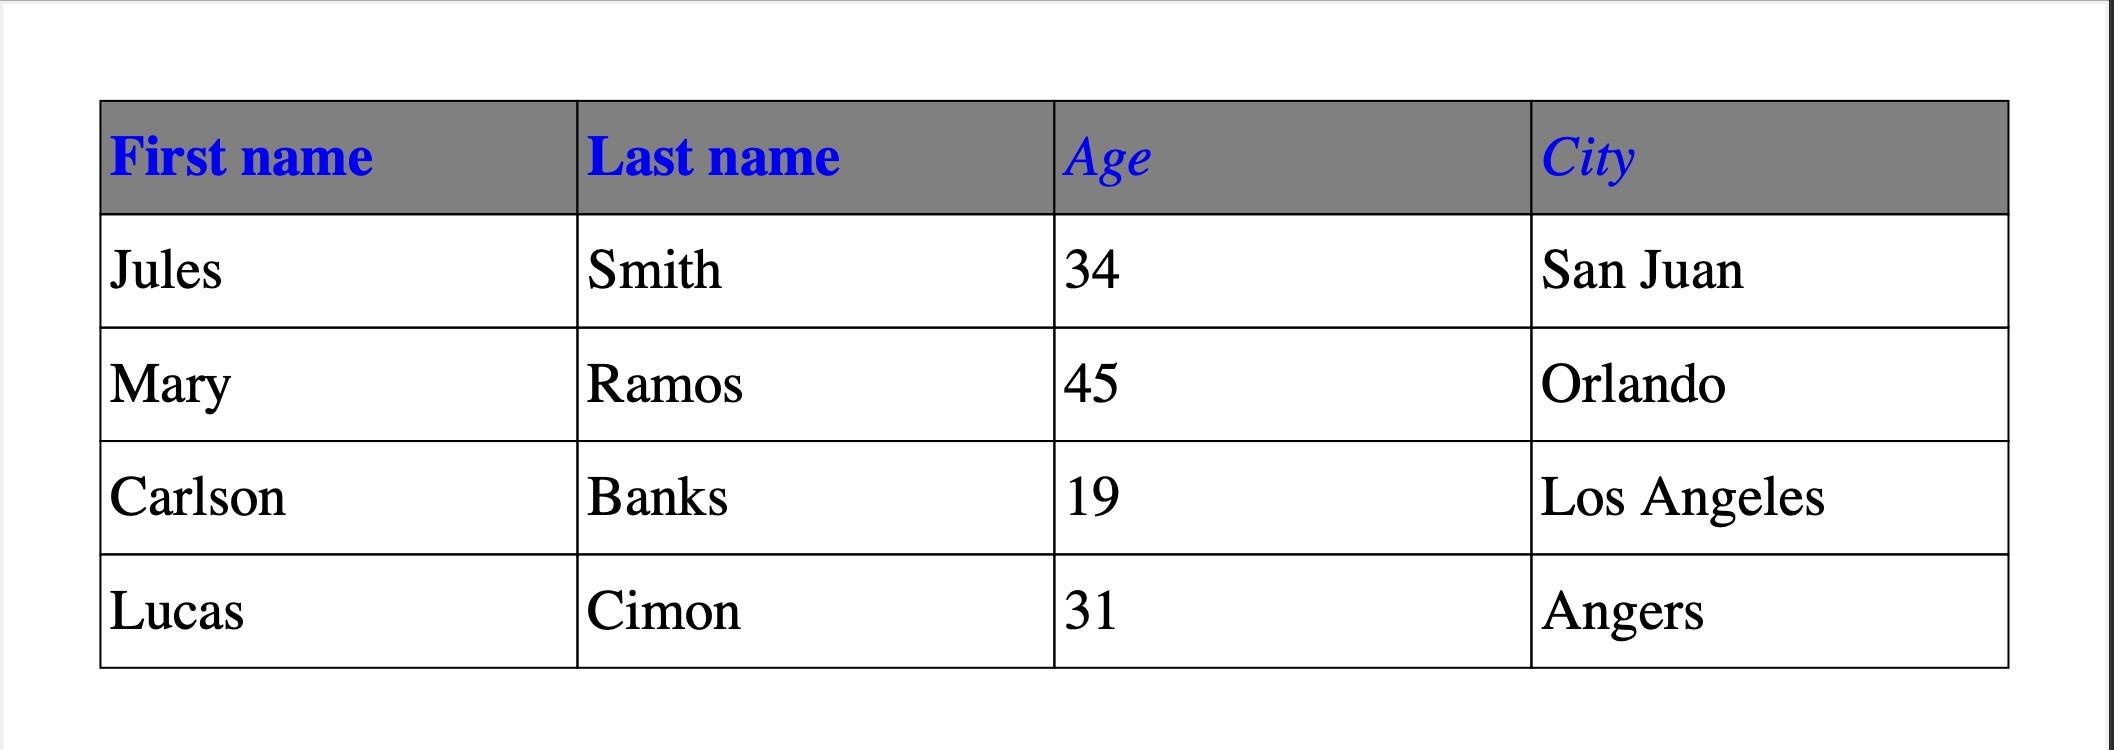
It's possible to override the style of individual cells in the heading. The overriding style will take precedence for any specified values, while retaining the default style for unspecified values:
...
headings_style = FontFace(emphasis="ITALICS", color=blue, fill_color=grey)
override_style = FontFace(emphasis="BOLD")
with pdf.table(headings_style=headings_style) as table:
    headings = table.row()
    headings.cell("First name", style=override_style)
    headings.cell("Last name", style=override_style)
    headings.cell("Age")
    headings.cell("City")
    ...
Result:
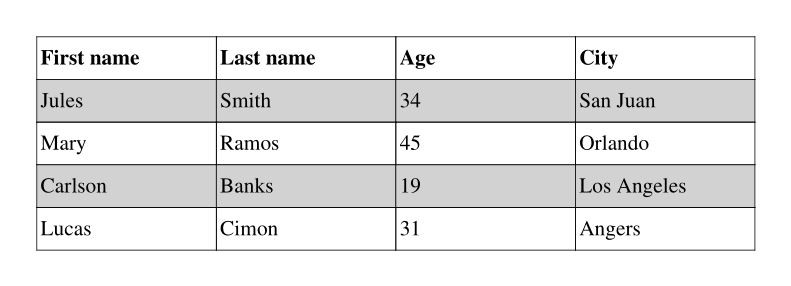
Set cells background
...
greyscale = 200
with pdf.table(cell_fill_color=greyscale, cell_fill_mode="ROWS") as table:
    ...
Result:
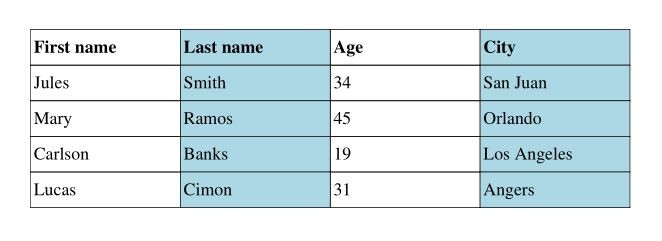
...
lightblue = (173, 216, 230)
with pdf.table(cell_fill_color=lightblue, cell_fill_mode="COLUMNS") as table:
    ...
Result:
The cell color is set following those settings, ordered by priority:
- The cell
style, provided toRow.cell() - The row
style, provided toTable.row() - The table setting
headings_style.fill_color, if the cell is part of some headings row - The table setting
cell_fill_color, ifcell_fill_modeindicates to fill a cell - The document
.fill_colorset before rendering the table
New in 2.7.9
Finally, it is possible to define your own cell-filling logic:
class EvenOddCellFillMode():
    @staticmethod
    def should_fill_cell(i, j):
        return i % 2 and j % 2

...
with pdf.table(cell_fill_color=lightblue, cell_fill_mode=EvenOddCellFillMode()) as table:
    ...
Set borders layout
...
with pdf.table(borders_layout="INTERNAL") as table:
    ...
Result:
...
with pdf.table(borders_layout="MINIMAL") as table:
    ...
Result:
...
pdf.set_draw_color(50) # very dark grey
pdf.set_line_width(.5)
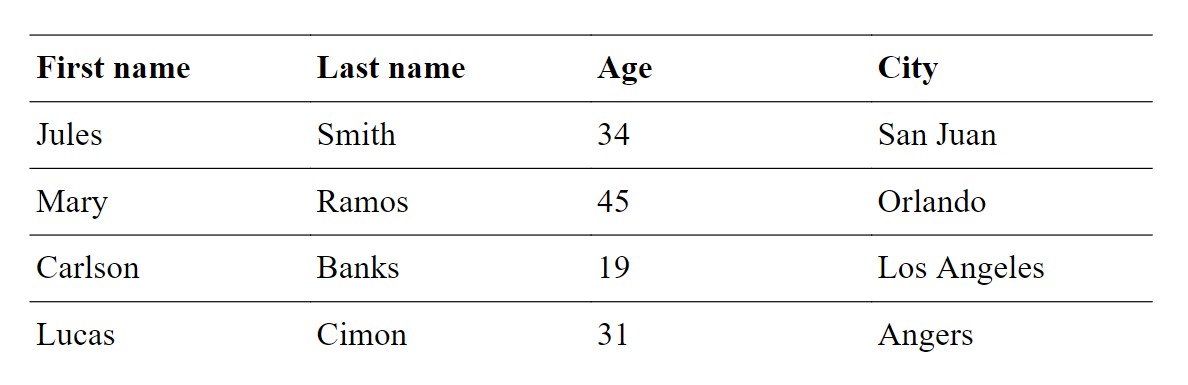
with pdf.table(borders_layout="SINGLE_TOP_LINE") as table:
...
Result:
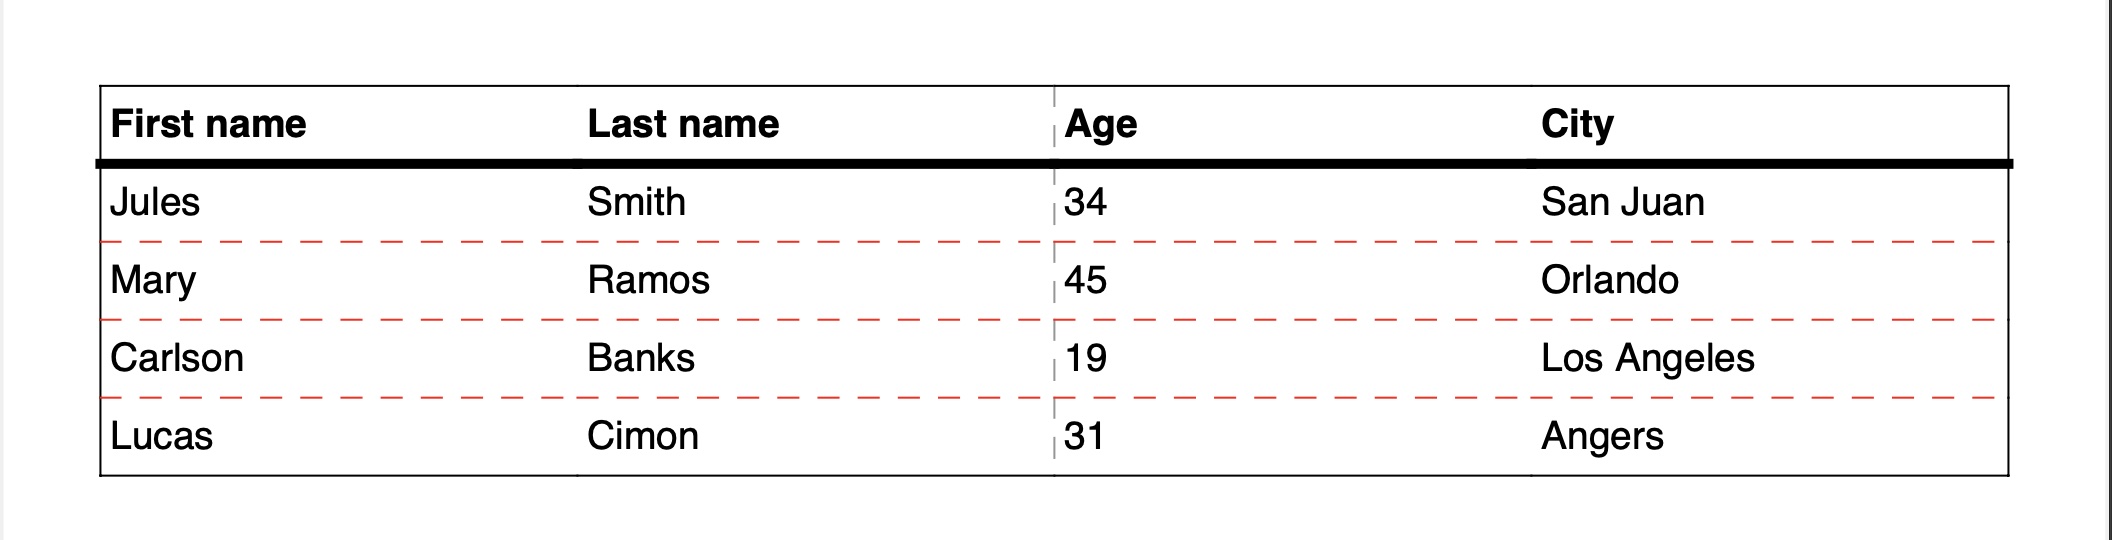
It is also possible to create a custom border layout, controlling thickness, color, and dash pattern:
from fpdf.table import TableBordersLayout, TableBorderStyle, TableCellStyle

gray = (150, 150, 150)
red = (255, 0, 0)
custom_layout = TableBordersLayout(
    cell_style_getter=lambda row_num, col_num, num_heading_rows, num_rows, num_cols: TableCellStyle(
        left=(
            True if col_num == 0
            else TableBorderStyle(color=(150, 150, 150), dash=2) if col_num == 2
            else False
        ),        bottom=True if row_num == num_rows - 1 else False,
        right=True if col_num == num_cols - 1 else False,
        top=(
            True if row_num == 0
            else TableBorderStyle(thickness=1) if row_num == num_heading_rows
            else TableBorderStyle(color=red, dash=2)
        ),
    )
)

with pdf.table(borders_layout=custom_layout) as table:
    ...
Result:
All the possible layout values are described there: TableBordersLayout.
Set cell borders
New in 2.8.2
from fpdf import FPDF
pdf = FPDF()
pdf.add_page()
pdf.set_font("Times", size=16)
with pdf.table() as table:
for data_row in TABLE_DATA:
row = table.row()
for datum in data_row:
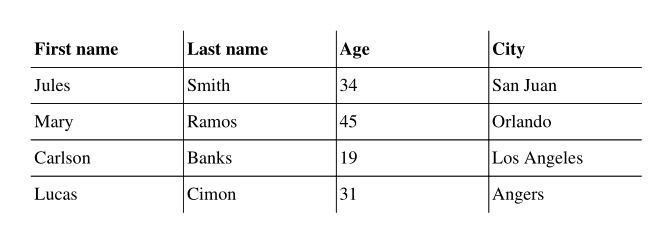
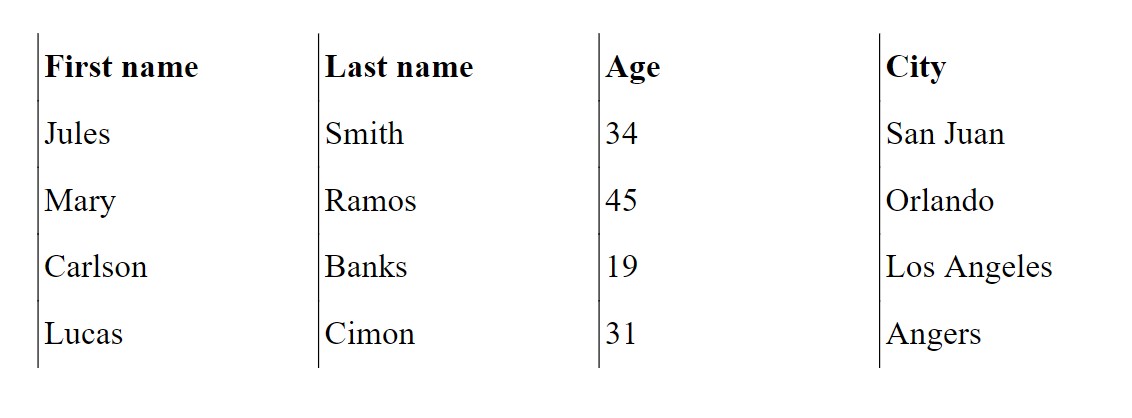
row.cell(datum, border="LEFT")
pdf.output('table.pdf')
Result:
from fpdf import FPDF
pdf = FPDF()
pdf.add_page()
pdf.set_font("Times", size=16)
with pdf.table() as table:
for data_row in TABLE_DATA:
row = table.row()
for datum in data_row:
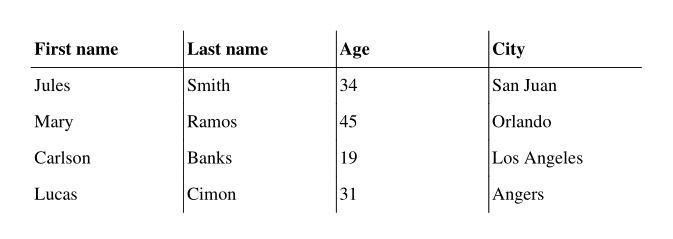
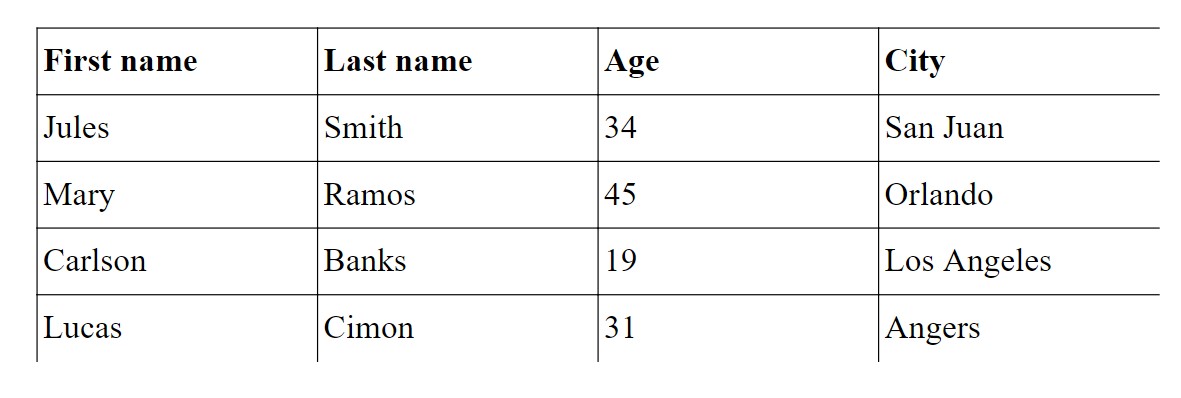
row.cell(datum, border="TOP")
pdf.output('table.pdf')
Result:
from fpdf import FPDF
from fpdf.enums import CellBordersLayout
pdf = FPDF()
pdf.add_page()
pdf.set_font("Times", size=16)
with pdf.table() as table:
for data_row in TABLE_DATA:
row = table.row()
for datum in data_row:
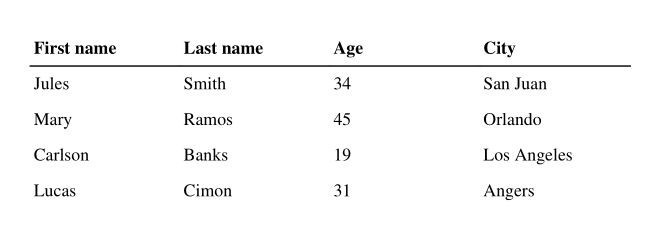
row.cell(datum, border=CellBordersLayout.TOP | CellBordersLayout.LEFT)
pdf.output('table.pdf')
Result:
All the possible borders values are described there: CellBordersLayout.
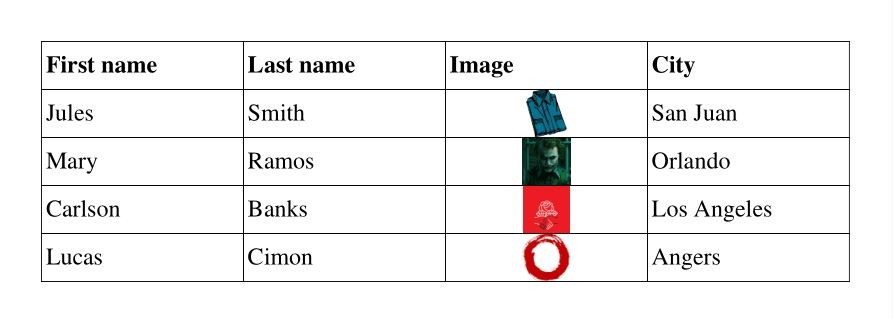
Insert images
TABLE_DATA = (
    ("First name", "Last name", "Image", "City"),
    ("Jules", "Smith", "shirt.png", "San Juan"),
    ("Mary", "Ramos", "joker.png", "Orlando"),
    ("Carlson", "Banks", "socialist.png", "Los Angeles"),
    ("Lucas", "Cimon", "circle.bmp", "Angers"),
)
pdf = FPDF()
pdf.add_page()
pdf.set_font("Times", size=16)
with pdf.table() as table:
    for i, data_row in enumerate(TABLE_DATA):
        row = table.row()
        for j, datum in enumerate(data_row):
            if j == 2 and i > 0:
                row.cell(img=datum)
            else:
                row.cell(datum)
pdf.output('table_with_images.pdf')
Result:
By default, images height & width are constrained by the row height (based on text content) and the column width. To render bigger images, you can set the line_height to increase the row height, or pass img_fill_width=True to .cell():
row.cell(img=datum, img_fill_width=True)
Result:

Adding links to cells
row.cell(..., link="https://py-pdf.github.io/fpdf2/")
row.cell(..., link=pdf.add_link(page=1))
Syntactic sugar
To simplify table() usage, shorter, alternative usage forms are allowed.
This sample code:
with pdf.table() as table:
    for data_row in TABLE_DATA:
        row = table.row()
        for datum in data_row:
            row.cell(datum)
Can be shortened to the following code, by passing lists of strings as the cells optional argument of .row():
with pdf.table() as table:
    for data_row in TABLE_DATA:
        table.row(data_row)
And even shortened further to a single line, by passing lists of lists of strings as the rows optional argument of .table():
with pdf.table(TABLE_DATA):
    pass
Gutter
Spacing can be introduced between rows and/or columns:
with pdf.table(TABLE_DATA, gutter_height=3, gutter_width=3):
    pass
Result:
Column span and row span
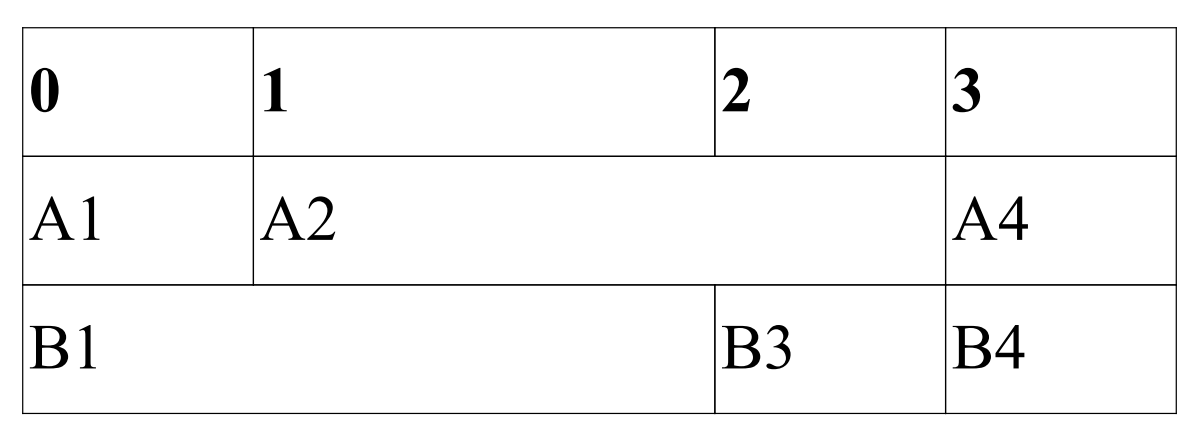
Cells spanning multiple columns or rows can be defined by passing a colspan or rowspan argument to .cell(). Only the cells with data in them need to be defined. This means that the number of cells on each row can be different.
    ...
with pdf.table(col_widths=(1, 2, 1, 1)) as table:
    row = table.row()
    row.cell("0")
    row.cell("1")
    row.cell("2")
    row.cell("3")

    row = table.row()
    row.cell("A1")
    row.cell("A2", colspan=2)
    row.cell("A4")

    row = table.row()
    row.cell("B1", colspan=2)
    row.cell("B3")
    row.cell("B4")
...
result:
...
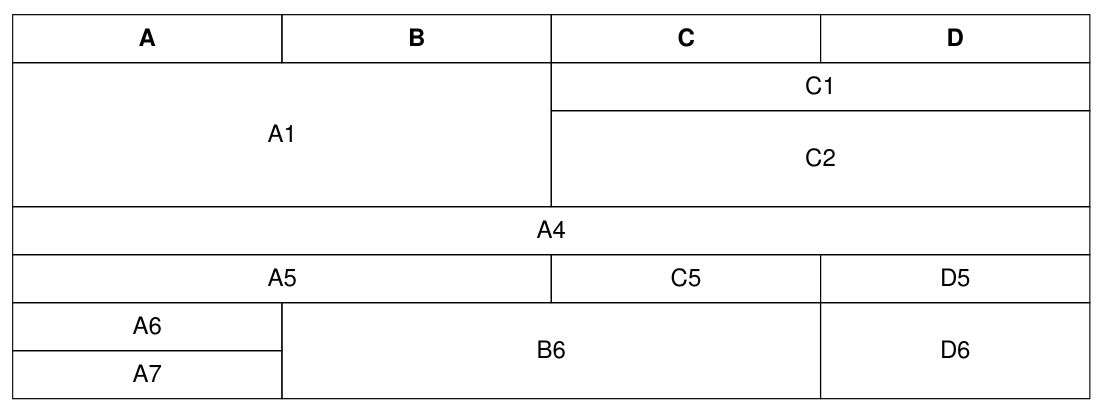
with pdf.table(text_align="CENTER") as table:
row = table.row()
row.cell("A1", colspan=2, rowspan=3)
row.cell("C1", colspan=2)
row = table.row()
row.cell("C2", colspan=2, rowspan=2)
row = table.row()
# all columns of this row are spanned by previous rows
row = table.row()
row.cell("A4", colspan=4)
row = table.row()
row.cell("A5", colspan=2)
row.cell("C5")
row.cell("D5")
row = table.row()
row.cell("A6")
row.cell("B6", colspan=2, rowspan=2)
row.cell("D6", rowspan=2)
row = table.row()
row.cell("A7")
...
result:
Alternatively, the spans can be defined using the placeholder elements TableSpan.COL and TableSpan.ROW. These elements merge the current cell with the previous column or row respectively.
For example, the previous example table can be defined as follows:
    ...
TABLE_DATA = [
    ["A",           "B",            "C",            "D"],
    ["A1",          TableSpan.COL,  "C1",           TableSpan.COL],
    [TableSpan.ROW, TableSpan.ROW,  "C2",           TableSpan.COL],
    [TableSpan.ROW, TableSpan.ROW,  TableSpan.ROW,  TableSpan.ROW],
    ["A4",          TableSpan.COL,  TableSpan.COL,  TableSpan.COL],
    ["A5",          TableSpan.COL,  "C5",           "D5"],
    ["A6",          "B6",           TableSpan.COL,  "D6"],
    ["A7",          TableSpan.ROW,  TableSpan.ROW,  TableSpan.ROW],
]

with pdf.table(TABLE_DATA, text_align="CENTER"):
    pass
...
result:
Table with multiple heading rows
The number of heading rows is defined by passing the num_heading_rows argument to Table(). The default value is 1. To guarantee backwards compatibility with the first_row_as_headings argument, the following applies: - If num_heading_rows==1: The value of first_row_as_headings defines whether the first row is treated as heading or standard row. - Otherwise, the value of num_heading_rows decides the number of heading rows.
with pdf.table(TABLE_DATA, num_heading_rows=2):
    pass
Result:
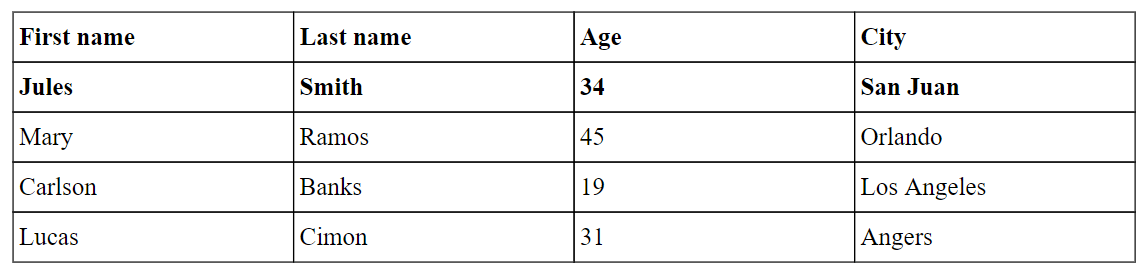
Table from pandas DataFrame or spreadsheet files
We have dedicated pages about those topics:
Using write_html
Tables can also be defined in HTML using FPDF.write_html. With the same data as above, and column widths defined as percent of the effective width:
from fpdf import FPDF

pdf = FPDF()
pdf.set_font_size(16)
pdf.add_page()
pdf.write_html(
    f"""<table border="1"><thead><tr>
    <th width="25%">{TABLE_DATA[0][0]}</th>
    <th width="25%">{TABLE_DATA[0][1]}</th>
    <th width="15%">{TABLE_DATA[0][2]}</th>
    <th width="35%">{TABLE_DATA[0][3]}</th>
</tr></thead><tbody><tr>
    <td>{'</td><td>'.join(TABLE_DATA[1])}</td>
</tr><tr>
    <td>{'</td><td>'.join(TABLE_DATA[2])}</td>
</tr><tr>
    <td>{'</td><td>'.join(TABLE_DATA[3])}</td>
</tr><tr>
    <td>{'</td><td>'.join(TABLE_DATA[4])}</td>
</tr></tbody></table>""",
    table_line_separators=True,
)
pdf.output('table_html.pdf')
Note that write_html has some limitations, notably regarding multi-lines cells.
"Parsabilty" of the tables generated
The PDF file format is not designed to embed structured tables. Hence, it can be tricky to extract tables data from PDF documents.
In our tests suite, we ensure that several PDF-tables parsing Python libraries can successfully extract tables in documents generated with fpdf2. Namely, we test camelot-py & tabula-py: test/table/test_table_extraction.py.
Based on those tests, if you want to ease table extraction from the documents you produce, we recommend the following guidelines:
- avoid splitting tables on several pages
- avoid the
INTERNAL/MINIMAL/SINGLE_TOP_LINEborders layouts