Scalable Vector Graphics (SVG)
fpdf2 supports basic conversion of SVG paths into PDF paths, which can be inserted into an existing PDF document or used as the contents of a new PDF document.
Not all SVGs will convert correctly. Please see the list of unsupported features for more information about what to look out for.
Basic usage
SVG files can be directly inserted inside a PDF file using the image() method:
from fpdf import FPDF

pdf = FPDF()
pdf.add_page()
pdf.image("vector.svg")
pdf.output("doc-with-svg.pdf")
Either the embedded .svg file must includes width and/or height attributes (absolute or relative), or some dimensions must be provided to .image() through its w= and/or h= parameters.
SVG complexity limits
fpdf2 applies configurable SVG complexity limits while converting SVG content to PDF drawing paths. These limits are intended to prevent small, malicious SVG files from consuming excessive CPU or memory through deeply nested or repeated <use> references or SVG control-flow elements.
The limits are configured on the FPDF instance:
from fpdf import FPDF
from fpdf.svg import SVGLimits

pdf = FPDF()
pdf.svg_limits = SVGLimits(
    max_use_depth=64,
    max_resolved_elements=500_000,
)
The default limits are suitable for typical SVG input. If a trusted SVG is larger than the defaults allow, applications can raise the limits. A limit can also be disabled with None, but this should only be done for trusted SVG content:
from fpdf import FPDF
from fpdf.svg import SVGLimits

pdf = FPDF()
pdf.svg_limits = SVGLimits(
    max_use_depth=None,
    max_resolved_elements=None,
)
When an SVG exceeds the configured limits, fpdf2 raises fpdf.errors.FPDFSvgLimitExceeded:
from fpdf import FPDF
from fpdf.errors import FPDFSvgLimitExceeded

pdf = FPDF()
pdf.add_page()

try:
    pdf.image("vector.svg")
except FPDFSvgLimitExceeded:
    # Reject the SVG, ask the user to simplify it, or retry only if trusted.
    ...
Detailed example
The following script will create a PDF that consists only of the graphics contents of the provided SVG file, filling the whole page:
import fpdf

svg = fpdf.svg.SVGObject.from_file("my_file.svg")

pdf = fpdf.FPDF(unit="pt", format=(svg.width, svg.height))
pdf.add_page()
svg.draw_to_page(pdf)

pdf.output("my_file.pdf")
Because this takes the PDF document size from the source SVG, it does assume that the width/height of the SVG are specified in absolute units rather than relative ones (i.e. the top-level <svg> tag has something like width="5cm" and not width=50%). In this case, if the values are percentages, they will be interpreted as their literal numeric value (i.e. 100% would be treated as 100 pt). The next example uses transform_to_page_viewport, which will scale an SVG with a percentage based width to the pre-defined PDF page size.
The converted SVG object can be returned as an fpdf.drawing.GraphicsContext collection of drawing directives for more control over how it is rendered:
import fpdf

svg = fpdf.svg.SVGObject.from_file("my_file.svg")

pdf = FPDF(unit="in", format=(8.5, 11))
pdf.add_page()

# We pass align_viewbox=False because we want to perform positioning manually
# after the size transform has been computed.
width, height, paths = svg.transform_to_page_viewport(pdf, align_viewbox=False)
# note: transformation order is important! This centers the svg drawing at the
# origin, rotates it 90 degrees clockwise, and then repositions it to the
# middle of the output page.
paths.transform = paths.transform @ fpdf.drawing.Transform.translation(
    -width / 2, -height / 2
).rotate_d(90).translate(pdf.w / 2, pdf.h / 2)

pdf.draw_path(paths)

pdf.output("my_file.pdf")
Converting vector graphics to raster graphics
Usually, embedding SVG as vector graphics in PDF documents is the best approach, as it is both lightweight and will allow for better details / precision of the images inserted.
But sometimes, SVG images cannot be directly embedded as vector graphics (SVG), and a conversion to raster graphics (PNG, JPG) must be performed.
The following sections demonstrate how to perform such conversion, using Pygal charts as examples:
Using cairosvg
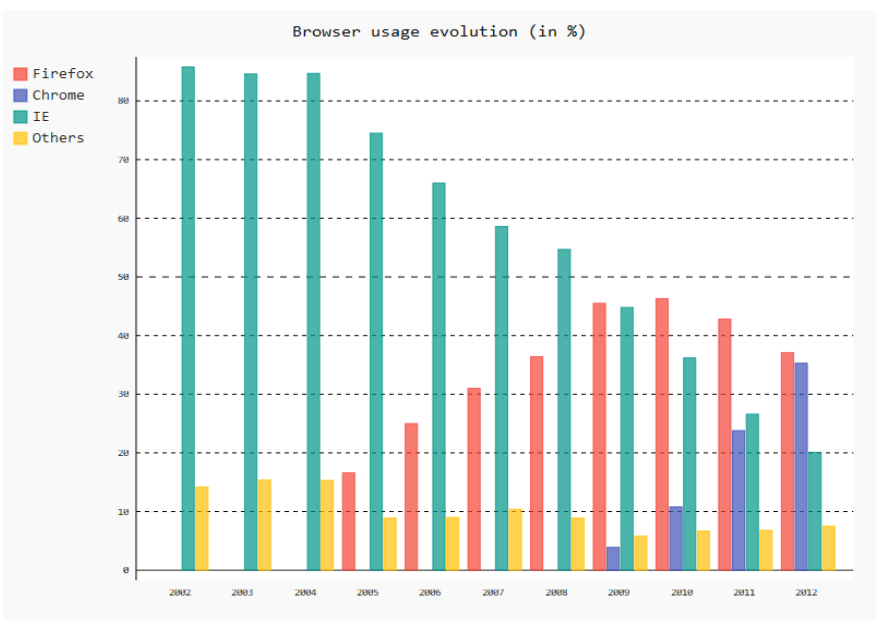
A faster and efficient approach for embedding Pygal SVG charts into a PDF file is to use the cairosvg library to convert the vector graphics generated into a BytesIO instance, so that we can keep these data in an in-memory buffer:
import pygal
from fpdf import FPDF
from io import BytesIO
import cairosvg

# Create a Pygal bar chart
bar_chart = pygal.Bar()
bar_chart.title = 'Browser usage evolution (in %)'
bar_chart.x_labels = map(str, range(2002, 2013))
bar_chart.add('Firefox', [None, None, 0, 16.6,   25,   31, 36.4, 45.5, 46.3, 42.8, 37.1])
bar_chart.add('Chrome',  [None, None, None, None, None, None,    0,  3.9, 10.8, 23.8, 35.3])
bar_chart.add('IE',      [85.8, 84.6, 84.7, 74.5,   66, 58.6, 54.7, 44.8, 36.2, 26.6, 20.1])
bar_chart.add('Others',  [14.2, 15.4, 15.3,  8.9,    9, 10.4,  8.9,  5.8,  6.7,  6.8,  7.5])
svg_img = bar_chart.render()

# Convert the SVG chart to a PNG image in a BytesIO object
img_bytesio = BytesIO()
cairosvg.svg2png(svg_img, write_to=img_bytesio, dpi=96)

# Set the position and size of the image in the PDF
x = 50
y = 50
w = 100
h = 70

# Build the PDF
pdf = FPDF()
pdf.add_page()
pdf.image(img_bytesio, x=x, y=y, w=w, h=h)
pdf.output('browser-usage-bar-chart.pdf')
!! Troubleshooting advice !!
You may encounter GTK (Gnome Toolkit) errors while executing the above example in windows. Error could be like following -
OSError: no library called "cairo-2" was found
no library called "cairo" was found
no library called "libcairo-2" was found
cannot load library 'libcairo.so.2': error 0x7e
cannot load library 'libcairo.2.dylib': error 0x7e
cannot load library 'libcairo-2.dll': error 0x7e
GTK from GTK-for-Windows-Runtime-Environment-Installer. Restart your editor. And you are all done. Using svglib and reportlab
An alternative, purely pythonic but slightly slower solution is to use reportlab and svglib:
import io
import pygal
from reportlab.graphics import renderPM
from svglib.svglib import SvgRenderer
from fpdf import FPDF
from lxml import etree

# Create a Pygal bar chart
bar_chart = pygal.Bar()
bar_chart.title = 'Sales by Year'
bar_chart.x_labels = ['2016', '2017', '2018', '2019', '2020']
bar_chart.add('Product A', [500, 750, 1000, 1250, 1500])
bar_chart.add('Product B', [750, 1000, 1250, 1500, 1750])
svg_img = bar_chart.render()

# Convert the SVG chart to a JPEG image in a BytesIO object
drawing = SvgRenderer('').render(etree.fromstring(svg_img))
jpg_img_bytes = renderPM.drawToString(drawing, fmt='JPG', dpi=72)
img_bytesio = io.BytesIO(jpg_img_bytes)

# Set the position and size of the image in the PDF
x = 50
y = 50
w = 100
h = 70

# Build the PDF
pdf = FPDF()
pdf.add_page()
pdf.image(img_bytesio, x=x, y=y, w=w, h=h)
pdf.output('sales-by-year-bar-chart.pdf')
The above code generates the following output: 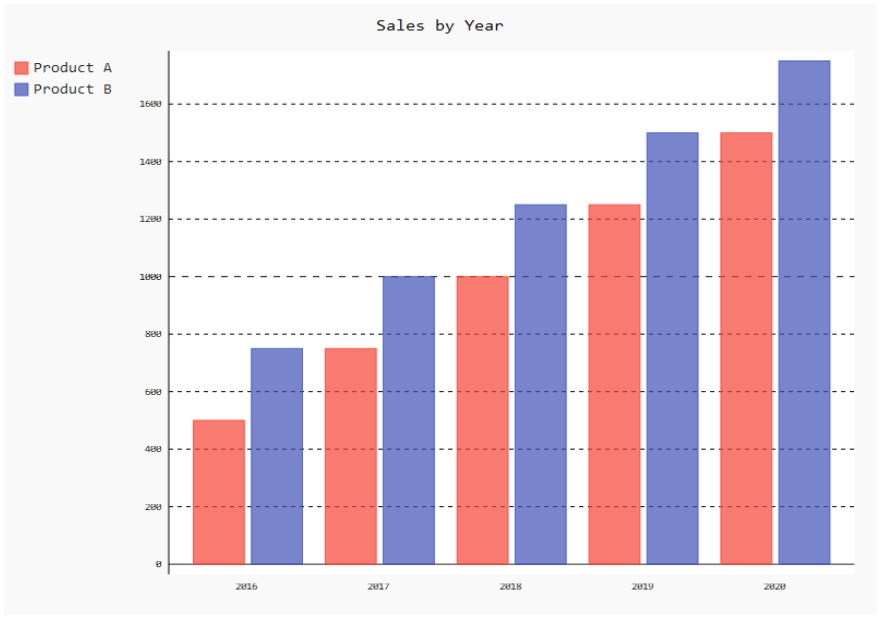
Performance considerations
Regarding performance, cairosvg is generally faster than svglib when it comes to rendering SVG files to other formats. This is because cairosvg is built on top of a fast C-based rendering engine, while svglib is written entirely in Python, and hence a bit slower. Additionally, cairosvg offers various options for optimizing the rendering performance, such as disabling certain features, like fonts or filters.
Warning logs
The fpdf.svg module produces WARNING log messages for some unsupported SVG tags & attributes. If need be, you can suppress those logs:
logging.getLogger("fpdf.svg").propagate = False
Supported SVG Features
- groups (
<g>) - paths (
<path>) - basic shapes (
<rect>,<circle>,<ellipse>,<line>,<polyline>,<polygon>) - basic
<image>elements - basic cross-references, with
defstags anywhere in the SVG code - basic
<switch>elements, selecting the first child without conditional processing attributes - stroke & fill coloring and opacity
- basic stroke styling
- basic CSS styling via
style="..."attributes and class rules in<style>tags - clipping paths
- gradients:
<linearGradient>and<radialGradient>elements with stops, opacity, transforms, and spread methods
Currently Unsupported Notable SVG Features
Everything not listed as supported is unsupported, which is a lot. SVG is a very complex format that has become increasingly complex as it absorbs more of the entire browser rendering stack into its specification.
However, there are some pretty commonly used features that are unsupported and may cause unexpected results, up to and including a normal-looking SVG rendering as a completely blank PDF.
There are some common SVG features that are currently unsupported, but that fpdf2 could end up supporting with the help of contributors :
<marker><pattern>- embedded non-image content (including nested SVGs)
<textPath>- many standard attributes
- complex CSS selectors or external *.css files.
Contributions would be very welcome to add support for more SVG features! 👍
If you are interested in contributing to fpdf2 regarding this, drop a comment on GitHub issue #537 and a maintainer will give some pointers to start poking with the code 😊